Tutorial: Running Stata in Galileo
Gettting started with Stata in Galileo
To get started with Galileo, log into your account using Firefox or Chrome.
Licensing
Stata is propriety software licensed by StataCorp LLC. In order to run Stata on Galileo and comply with our terms of use, you must have a valid Stata 16 license.
We have implemented a bring-your-own license system. To use Stata with Galileo please add your stata.lic file from your home or office computer running Stata 16 to your Galileo project folder. On OS X, the file can typically be found at /Applications/Stata/stata.lic or by searching the file system.
We do not sell Stata licenses. Additional information on Stata can be found at their website. Any other inquiries about Stata or licensing can be directed to support@hypernetlabs.io.
Understanding the user interface and cloning a Mission
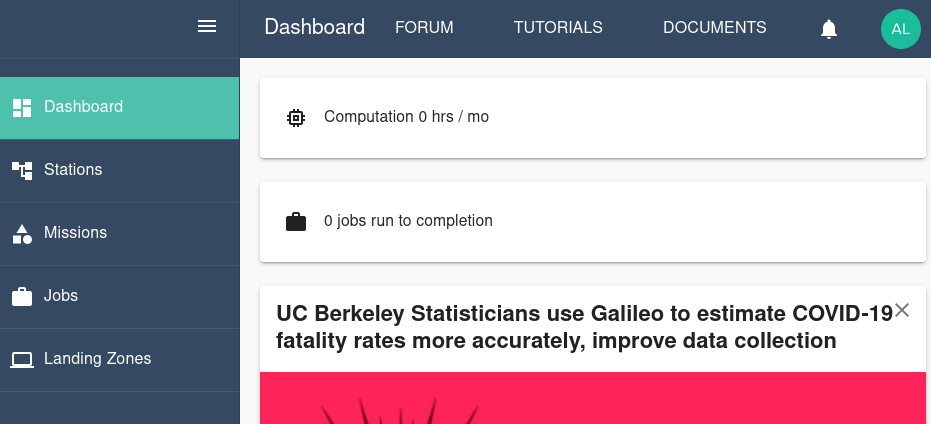
When you log into Galileo, the first thing you’ll see is your Dashboard:
To run the Stata example, start by navigating to the Missions tab using the side menu. Clone the Stata Batch example Mission from the Explore Missions tab. Use the filter to search for the mission by name and click “Apply”.

Once you have found the correct Mission, click “View Mission”.

To clone the public Mission to your account, click the “Clone” button in the upper right corner of the interface. Choose between creating a public or private clone and also choose which Cargo Bay to use.

You will now see a cloned copy of the Mission in your Missions.

Let’s take a look at our files
The Stata example folder contains two files: carsdata.do and carsdata.dta. The carsdata.do script conducts a linear regression using the carsdata.dta dataset and makes a simple plot.
Running a job and collecting results
Now we are ready to run a job using the Mission. Click the Run button in the upper right corner of the Mission tab. You will see a “Mission run successfully!” message. At the bottom of the Mission tab, you can track the progress of the job.

Once the computation is completed, the job will shut down and collect the results. Once the job progress reads “Completed”, you can download the results by opening the three-dot menu and clicking Download.

Let’s take a look at the the output.log file first, which returns the results of the regression and simulation:

Next, if we look in the results folder, we can see the plot we created for the regression:

Contact us
We hope this tutorial was helpful. Please let us know if you have any questions or any problems using Galileo. Your feedback is extremely important to us. Contact us anytime at matthew@hypernetlabs.io or alexander@hypernetlabs.io.